Ever heard someone say ‘House prices double every 10 years!’? It’s a general statement that is probably mentioned as a way for people to express that they believe the property market can be a good investment. But do property prices double every 10 years?
After some extensive research I can tell you the answer is no. House prices do not double every 10 years as a rule. But how often do property prices double in value in the UK? Let me share my findings with you and explain why you should not only rely on capital growth when investing in property.
The history of property prices is very interesting and still very appealing though, so it’s worth taking the time to look at the data. I will show you some charts and share some statistics. But more importantly, I’ll also share some details of properties I’ve owned in the past and what there values are worth today.
Contents
- When Did Records Begin For Tracking House Prices?
- Summary of Popular UK House Price Indices
- Here Is What The Data Showed
- Data Extracted From Nationwide House Price Index
- Difference In Data Between Nationwide HPI and HM Land Registry HPI
- Calculating The Average Property Value Increase Per Year
- What Percentage Do Property Prices Need To Grow Each Year To Double Every 10 Years?
- Are HPI’s Useful For Property Investors and Landlords?
- My First Home
- My Second Home
- My First Renovation Project
- What Does All This Data Mean For Property Investors?
- What Effect Does Inflation Have On House Prices?
- Are you benefiting from inflation?
- Why Do Property Values Increase?
- What Causes Property Values To Decrease?
- What Determines The Market Value Of A Property?
When Did Records Begin For Tracking House Prices?
Nationwide Building Society started recording the average property prices in the UK in 1952, based on the mortgages they approved each year. Over the years, other lenders and organisations have started recording average prices and each now produce, what is referred to as, a House Price Index (HPI).
Each HPI captures data slightly differently. Lenders use numbers from their own approved mortgage products and some capture data each quarter, whilst others capture data on a monthly bases.
There are also differences from other two main organisation who don’t lend and only capture the data.
The Office of National Statistics (ONS) captures data from 75-80% of the mortgage market and doesn’t include cash sales. Whereas HM Land Registry captures data from both cash sales and mortgages, but only in England and Wales, and doesn’t include sales for properties that have not sold at least twice since 1995.
Summary of Popular UK House Price Indices
| Index | Data | Exclusions | Coverage | Since |
| ONS | Survey of 75-80% of mortgage market | Cash sales | UK | 1968 |
| Nationwide | Nationwide mortgage lending | Cash Sales | UK | 1952 |
| Halifax | Halifax mortgage lending | Cash Sales | UK | 1983 |
| HM Land Registry | Repeat sales data | Excludes properties that have not sold at least twice since 1995 | England and Wales | 1968 |
There are a few key points I would like to highlight when it comes to reading the data from any HPI:
1. There isn’t a HPI that captures all data from sales using cash or a mortgage for the whole of the UK.
2. Of the indices based on mortgage data, the ONS HPI is based on the most amount of data.
3. As all records are based on sales prices, indices are only capturing a small amount of stock in any given time period.
4. The difference between purchasing a property with a mortgage or cash, can have an effect on the value of a property. Property sellers may accept a lower cash offer to increase the speed of the sale.
5. Information on average prices are useful for some industries and government when considering changes to policy, e.g. Stamp Duty Land Tax. But I don’t see many benefits for individuals analysing HPI’s when they are looking to buy or invest in the property market. There is only one benefit I can think of, which I will cover next.
Here Is What The Data Showed
We all know that there will always be peaks and troughs on the property market, but it’s worth looking back as far as we can to see what the future could possibly hold.
“If you want to know the future, look at the past”.
Albert Einstein
That is why I decided to use the data from the Nationwide HPI, simply because its records date back the furthest and we want to know if average property prices have doubled every 10 years, starting from 1952.
Data Extracted From Nationwide House Price Index
| Year Q4 | 10 Year Prediction (column (c) doubled) | Average House Price Recorded | Target Reached | 10 Year Prediction (Previous decade) | Target Reached |
| (a) | (b) | (c) | (d) | (e) | (f) |
| 1952 | – | £1,891 | – | – | – |
| 1962 | £3,782 | £2,673 | No | £3,782 | No |
| 1972 | £7,564 | £7,880 | Yes | £5,346 | Yes |
| 1982 | £15,128 | £25,580 | Yes | £15,760 | Yes |
| 1992 | £30,256 | £50,168 | Yes | £51,160 | No |
| 2002 | £60,512 | £115,940 | Yes | £100,336 | Yes |
| 2012 | £121,024 | £162,924 | Yes | £231,880 | No |
| 2022 | – | – | – | £325,848 | – |
Having looked at all the data from the Nationwide HPI, here are some other interesting statistics.
The longest time taken for the average UK house price to double:
14.25 years from 1989 Q2 to 2003 Q3.
The shortest time taken for the average UK house price to double:
3 years from 1971 Q1 to 1974 Q1.
The average time for the average UK house price to double:
8.5 years.
All of these numbers are very inspiring, but be mindful that they do not resemble patterns for all types of properties in all areas of the UK.
Difference In Data Between Nationwide HPI and HM Land Registry HPI
Lets take a look at the difference in data provided by Nationwide and HM Land Registry, since 1968:
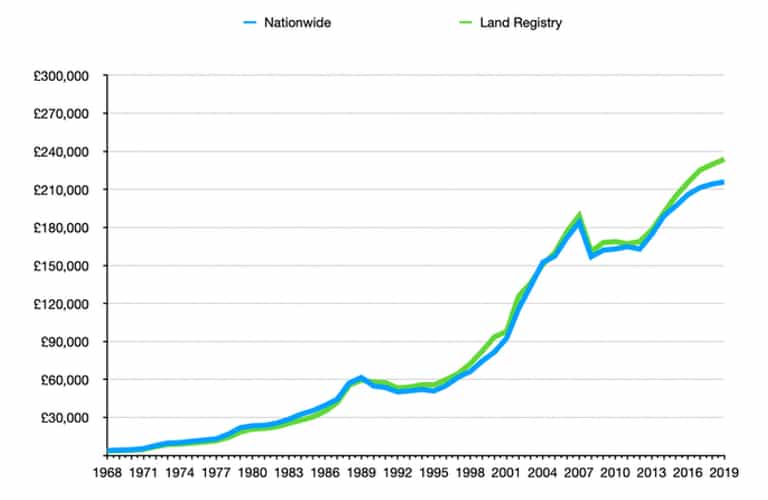
The average house price in 1968 Q4 was £4,089 with the Nationwide HPI, and £3,696 with HM Land Registry HPI. That’s a difference of 9.61%.
The average house price in 2019 Q4 was £215,925 with the Nationwide HPI, and £233,739 with HM Land Registry HPI. That’s a difference of 7.62%.
In May 2014 the Institute for Fiscal Studies produced a paper on Measuring House Prices: A Comparison of Different Indices. It’s a lengthy document that explains the differences and variables affecting the average house price between the different indices.
The amount of detail covered far exceeds the information I have covered in this article, or the amount I would want to cover, as I’m approaching the original question from an investors point of view.
Having read the paper, I would also like to point out that it identifies that there is very little data on home improvements or deterioration on any particular property. Which proves that the indices do not have full control of the impact these circumstances have on prices.
Calculating The Average Property Value Increase Per Year
When we look at the increase in value of the ‘average’ property price on the Nationwide HPI over the last 10 years between 2009 Q4 and 2019 Q4, we can calculate the average percentage increase per year:
2009 average house price was £162,116
2019 average house price was £215,925
£215,925 – £162,116 = £53,809
£53,809 ÷ £162,116 x 100 = 33.19%
33.19 ÷ 10 years = 3.31% average increase per year
Lets look at the previous 10 years between 1999 Q4 and 2009 Q4 using the same HPI:
1999 average house price was £74,638
2009 average house price was £162,116
£162,166 – £74,638 = £87,528
£87,528 ÷ £74,638 x 100 = 117.27%
117.27% ÷ 10 years = 11.72% average increase per year
What Percentage Do Property Prices Need To Grow Each Year To Double Every 10 Years?
Property prices would need to increase with an average of 7.18% year on year, in order to double in price every 10 years.
Are HPI’s Useful For Property Investors and Landlords?
The main problem with analysing the HPI data, is that as a property investors I do not invest in the average house price market. That would be similar to investing in stocks and shares. What I do is invest in singular properties. In other words, I don’t invest in average prices, I invest in actual prices.
After having looked at the ‘average’ house price data, I would now like to share some ‘actual’ sales data with you from my previous property purchases.
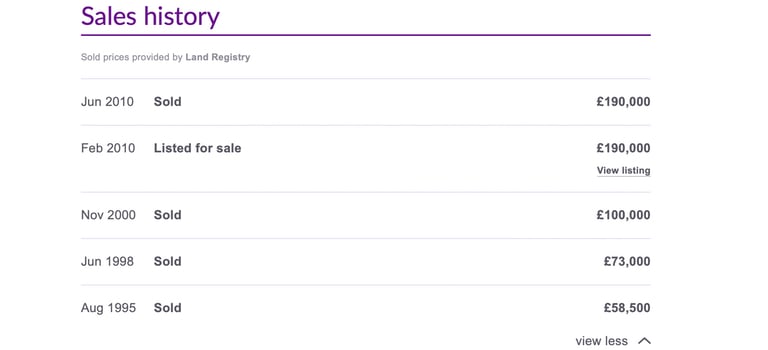
My First Home
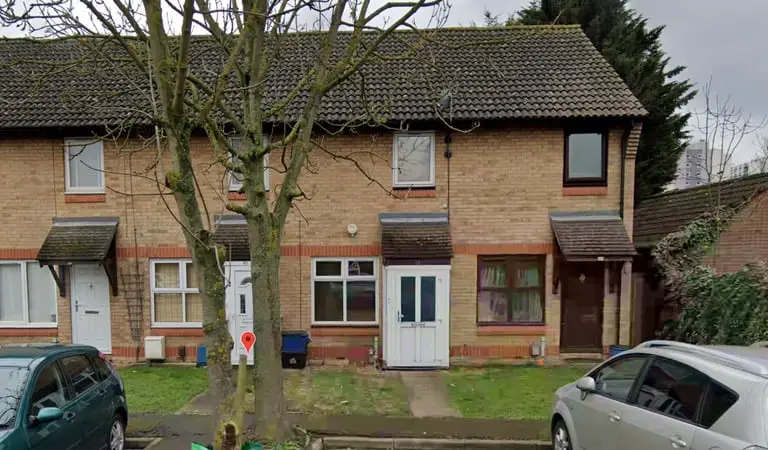
I purchased this house for £58,500 in August 1995 and sold in June 1998 for £73,000. I was the second owner of this property and it was only a few years old when I bought it.
I didn’t do any work other than some light decoration and I accumulated £12,500 equity in a little under 3 years, which I then used towards a deposit for my next home.
This property was last purchased in June 2010 for £190,000 and Zoopla’s price estimate is now £363,000 (as at April 2020).
My Second Home
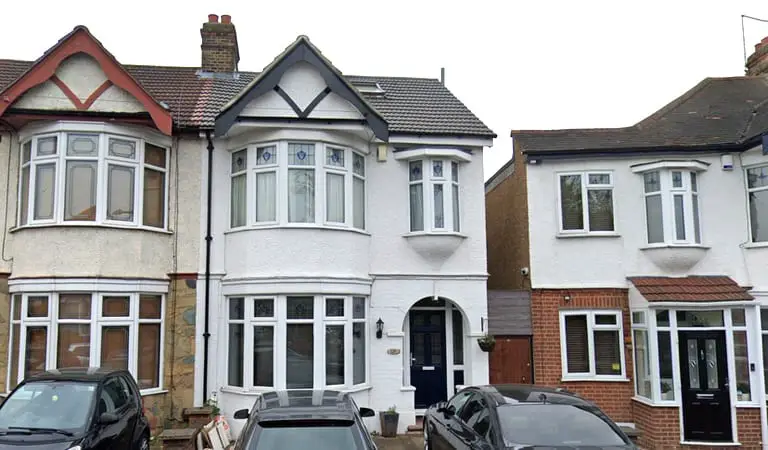
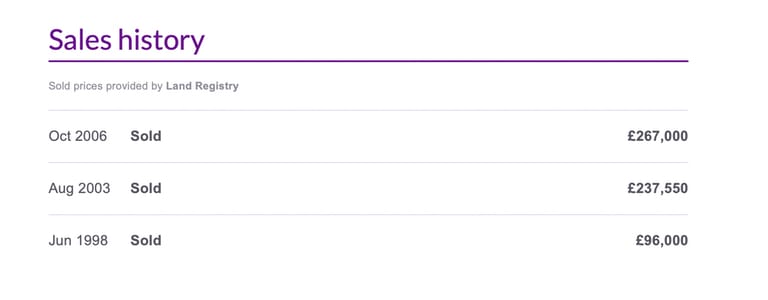
I purchased this house for £96,000 in June 1998 and sold in August 2003 for £237,550. The decor was outdated when I bought it and I had a new central heating system, new kitchen and new bathroom installed, a new driveway and I decorated throughout.
I estimate that I spent £25,000 renovating this property over the 5 years I lived there.
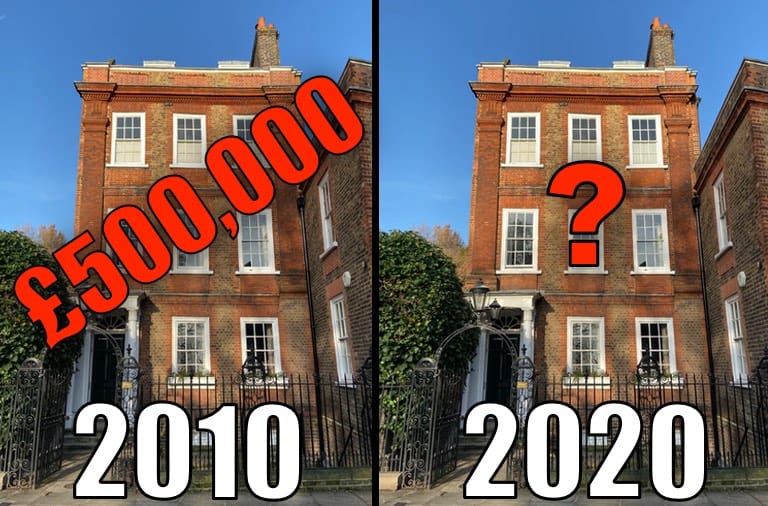
This property was last purchased in October 2006 for £267,000 and Zoopla’s price estimate is now £501,000 (as at April 2020).
My First Renovation Project
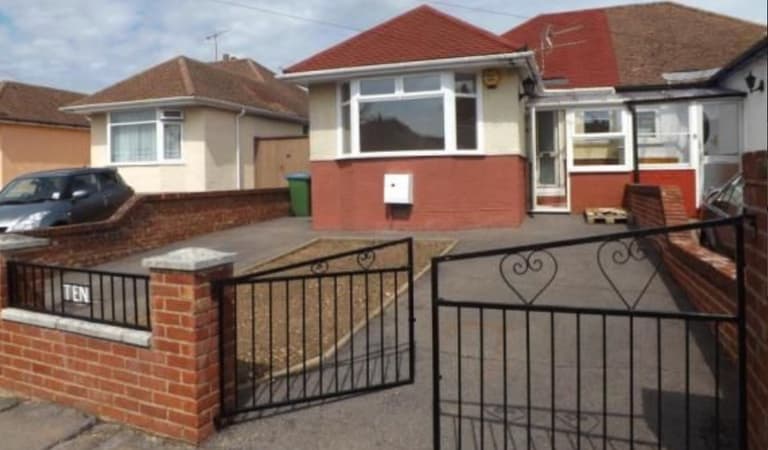
Let’s look at the numbers of a property that I invested in for a flip (buy, renovate and sell). I purchased the property for £143,500.00 in May 2013 and I sold it in February 2014 for £177,500.00.
I shared how much I made along with the total renovation costs and associated fees with buying and selling this property, in this short video:
There is something else very interesting that I would like to share about this property.
I received a copy of the deeds during the purchase process and I noticed that the property was first sold in 1938 for £500.
We can do some simple arithmetic to see if the price of this property has doubled in line with the ‘every 10 years’ theory:
| Year | Price/Speculation | Remarks |
| 1938 | £500 | Original sale price |
| 1948 | £1,000 | – |
| 1958 | £2,000 | – |
| 1968 | £4,000 | – |
| 1978 | £8,000 | – |
| 1988 | £16,000 | – |
| 1998 | £32,000 | – |
| 2008 | £64,000 | Sold February 2014 for £177,500 |
| 2018 | £128,000 | – |
Zoopla’s price estimate is now £247,000 (as at April 2020). So over the course of an 80 year period, this property has more than doubled in value decade on decade.
What Does All This Data Mean For Property Investors?
Well, clearly there is no straight line. It’s unreasonable to assume that you could purchase any property and expect it to double in value over the next 10 years.
The historical sales data for my renovation project is very inspiring though. Which reinforces the advice of professional investors who state that you need to invest for the long term.
Investing for the long term means that you must ensure the numbers work before purchasing so that the rental income you receive covers any over heads, and the running costs, whilst the property is tenanted.
Every buy-to-let property should be treated as a business. If any business fails to reach at leasts its running costs, it will not survive. A failing buy-to-let will lead to having to evict the tenant(s) and possibly a repossession which will have an impact on other property prices in the area.
When looking for a property it is very important to recognise the condition of the property compared to other properties that have recently sold. A property which requires a fair amount of renovation works, is not going to be worth the same amount as a property next door which sold 6 months previously in excellent condition.
What Effect Does Inflation Have On House Prices?
You cannot have a conversation about the increase of property prices without talking about inflation.
In 2016 the Consumer Price Index Housing (CPIH) became the official measure of inflation and replaced the older Consumer Price Index (CPI). The CPIH measures a sample of the typical costs for goods and services bought by average households. And it now includes mortgage costs, home insurance, estate agents’ fees and property renovation expenditure, hence the addition of the ‘H’.
The increase in prices for goods and services will have a direct impact on the prices of the property market. If it cost more to buy the materials and hire the services required to build a property, then the price to purchase that property will increase.
In 1990 the average house price was recorded to be £54,919 by the Nationwide HPI. A loaf of bread cost just £0.51 and a pint of milk was £0.32 as recorded by the ONS. Today, all those numbers are much higher.
Imagine having a mortgage with a 75% loan to value on that property today! If you purchased that ‘average’ property in 1990 on an interest only mortgage, you would only owe the lender £41,189.25 today, with the ‘average’ house price currently recorded as £217,911.
Are you benefiting from inflation?
Borrowers can benefit more from inflation than lenders because the amount they borrowed deflates in value over time. If you borrow £100,000 today to buy a property, in 20 years time that same £100,000 is going to be worth far less in terms of its purchasing power.
Why Do Property Values Increase?
Inflation is the main reason property prices increase. In addition, we sometimes have to cope with quantitive easing. And the more currency that is printed into circulation, the more that currency will fall in value. This causes an increase in prices from bread to land, and everything in between.
Did you notice that I used the word ‘currency’ and not ‘money’? That’s a topic for another article which I’ll save for another time.
Other factors which can cause property values to increase are:
- Increase in population
- People living longer
- Increase in employment
- Decrease in number of properties for sale
- Improved transport links
- Buoyant lending market
What Causes Property Values To Decrease?
There are actually fewer instances, outside of your control, that can cause property values to decrease rather than increase.
5 likely causes for property values to decrease are:
- An increase to mortgage rates
- Decrease in employment in your area
- Repossessions in the surrounding area
- An increase of comparable sales
- Natural disasters
What Determines The Market Value Of A Property?
There are many factors that affect property prices including, but not limited to; inflation, location, employment, transport links, lending, population and other investments and developments in the area.
A recorded market value is an opinion provided by an experienced valuer who will account for the location, size, condition, recent local sales and demand of the property. Additional features can enhance the value and/or increase the chances of the value being realised in the sale.
Ultimately, a property is only worth what someone is willing to pay for it.
